
Disclaimer: All information presented is for educational purposes only and should not be interpreted as financial advice or a recommendation for trading or investment decisions.
Introduction: What Defined Q3 and What Matters for Q4
Global markets ended Q3 with notable resilience despite persistent inflation, restrictive monetary policy, and elevated energy prices. Global equities performed strongly, supported by solid corporate earnings and continued AI investment, while crude oil rallied amid the US-Iran conflict and the closure of the Strait of Hormuz. Gold recorded substantial gains but faced headwinds from rising Treasury Yields and renewed interest-rate hike expectations. Meanwhile, USD/JPY remained volatile, reaching 163.991 before closing September at 157.350, as the wide interest-rate differential between the Bank of Japan (BoJ) and Fed continued to weigh on the Yen. As Q4 begins, the key question is whether inflation and Treasury Yields will ease or remain elevated, as shifts in energy prices, economic conditions, and central bank policy could significantly reshape the outlook for Gold, currencies, and broader financial markets.
Global Macro Outlook
The global economy entered Q4 with growth remaining relatively resilient, but the combination of persistent inflation, elevated energy prices and tighter monetary policy continues to create uncertainty over the outlook.
US Economic Growth
The US economy remained one of the stronger performers in Q3. The S&P Global US Composite PMI rose to 58.4 in September, marking the strongest expansion in private-sector business activity since July 2021. The strength of business activity suggests that the US economy has so far remained resilient despite higher borrowing costs and elevated input prices. The Federal Reserve’s September projections also reflected this resilience, with the median forecast for 2026 real GDP growth raised to 2.3%, up from 2.2% in its June projections.
However, the resilience of economic activity has been accompanied by signs of pressure elsewhere in the economy. Inflation remained elevated throughout Q3, staying well above the Fed’s 2% target. Headline CPI eased slightly from 3.5% in June to 3.4% in July before holding at 3.4% in August. While the pace of inflation has stabilized, it remains significantly above the Fed’s target, limiting the central bank’s ability to ease policy aggressively.
The labor market also showed signs of losing momentum. The unemployment rate remained relatively low, moving from 4.1% in July and August to 4.2% in September, indicating that the labor market remained broadly resilient. However, job creation weakened toward the end of the quarter. September payrolls increased by only 29,000, while July’s initial decline of 23,000 and August’s 162,000 gain were later subject to revisions. Taken together, the data suggest that the labor market is cooling, even if it has not yet deteriorated sharply.
This creates a delicate balance for the Fed heading into Q4. Economic activity remains strong enough to withstand restrictive policy, while the labor market has not weakened enough to force an immediate policy reversal. At the same time, inflation remains elevated. This combination leaves the Fed with room to maintain a restrictive stance and potentially raise rates further if inflationary pressures persist.
Central Bank Policy
The inflationary environment also contributed to a renewed tightening bias among several major central banks during Q3. The Fed raised its target range by 25 basis points to 3.75%–4.00% in September, while the ECB also increased its key rates by 25 basis points in September. The Reserve Bank of Australia raised its cash rate by 25 basis points to 4.60% at the end of September, citing elevated inflation and higher global energy prices. The Bank of Japan also continued its gradual policy normalization, raising rates in both July and September.
Several of these central banks have also maintained a cautious or hawkish stance on inflation. The ECB’s September decision cited ongoing inflationary pressures from the Middle East conflict. The RBA similarly highlighted elevated inflation, higher energy prices and persistent domestic cost pressures when it raised rates in September.
Market expectations reflect this continued concern over inflation.
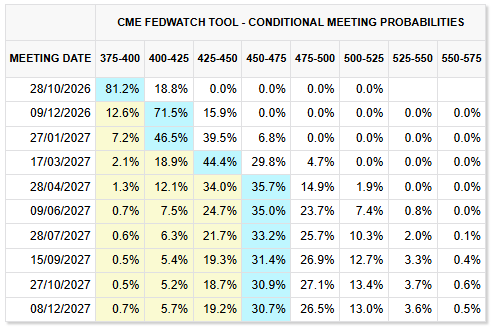
As Q4 begins, markets are pricing in a high probability of another Fed rate hike in December, with the probability reaching around 71.5% as of October 7. This contrasts with expectations for October, where the probability of a hike had fallen sharply following the weaker September employment report.
Overall, the global macroeconomic backdrop entering Q4 can be characterized as resilient growth alongside slowing labor-market momentum and persistent inflationary pressure. The key question for the final quarter will be whether inflation begins to moderate without a more significant deterioration in economic activity. If inflation remains elevated, major central banks may maintain or extend their restrictive policy stance, keeping Treasury Yields and the US dollar supported. However, a sharper slowdown in growth or employment could eventually shift expectations toward less restrictive policy, creating a very different environment for currencies, Gold and other major asset classes.
Key Macro Risks and Catalysts for Q4 2026
Beyond the usual economic data and central bank decisions, several broader developments could shape financial markets in Q4 2026. Investor concerns over elevated AI valuations, upcoming major IPOs, and the sustainability of US government debt could trigger shifts in risk appetite and Treasury Yields. These developments will be important to monitor, particularly for their potential impact on Gold, the US dollar, and broader equity markets.
AI Investment and the Risk of a Broader Market Correction

The AI investment boom remains a key market theme, but questions are emerging over whether future earnings can justify the sector’s high valuations and substantial infrastructure spending. Following SpaceX’s record $85.7 billion IPO in June, Anthropic’s anticipated November listing could further test investor appetite for high-valued AI businesses, while OpenAI’s potential IPO remains a longer-term prospect.

Large IPOs could compete for capital that might otherwise flow into existing equities, while disappointing earnings or weak IPO demand could intensify concerns over AI valuations and weaken risk appetite. A broader market correction could support Gold and the US dollar through safe-haven demand, although the direction of both assets would depend on how Treasury Yields and expectations for Fed policy respond. Investors should monitor IPO demand, technology earnings, capital expenditure plans, and corporate credit conditions.
Treasury Yields and Fiscal Pressure

US federal debt surpassed $40 trillion for the first time in August 2026, reaching its highest level on record. Combined with persistent fiscal deficits and rising interest expenses, the growing debt burden could increase government borrowing needs and place upward pressure on Treasury Yields.

Treasury Yields are also a key driver of Gold prices. Rising yields generally pressure Gold by increasing the opportunity cost of holding a non-yielding asset, while falling yields tend to support Gold. However, the relationship can vary depending on inflation expectations, real yields, and broader market conditions.
As a result, Treasury Yields will be a key macroeconomic indicator to monitor in Q4, alongside inflation data, government borrowing requirements, and demand for US government debt. Their direction could significantly influence Gold’s outlook and provide important signals about broader financial market conditions.
Gold Outlook
Fundamental Analysis
Gold closed Q3 with a 3.56% quarterly gain, although the metal experienced significantly stronger gains during the quarter before giving back part of its advance in September. Gold initially rallied strongly in August, but the subsequent rise in Treasury Yields, combined with another interest rate hike by several major central banks in September, placed renewed pressure on the metal and reduced a significant portion of its earlier gains.
Heading into Q4, the key fundamental drivers for Gold are expected to remain oil prices, inflation, Fed policy and Treasury Yields. These factors are closely connected, particularly through the impact of energy prices on inflation and the resulting expectations for monetary policy.
The development of the US-Iran conflict will therefore remain an important factor to monitor. If tensions improve and the conflict moves toward a resolution, oil prices could come under downward pressure as concerns over energy supply disruptions ease. Lower energy prices could, in turn, reduce inflationary pressures and weaken expectations for another Fed rate hike in December. At the same time, if Treasury Yields decline from their current levels, the combination of lower yields, softer inflation expectations and a less restrictive outlook for Fed policy could create a more supportive environment for Gold in Q4.
However, if the situation surrounding the US-Iran conflict does not improve, oil prices and inflationary pressures could remain elevated. This could reinforce expectations that the Fed will maintain a restrictive policy stance or potentially raise rates further, while keeping Treasury Yields elevated. Such an environment could create continued headwinds for Gold.
Overall, Gold’s Q4 outlook will depend heavily on whether inflationary pressures begin to ease and whether Treasury Yields can move lower. A combination of lower oil prices, moderating inflation, reduced expectations for further Fed tightening and declining Treasury Yields would provide a more supportive fundamental backdrop for Gold, while persistent energy and inflationary pressures could continue to limit its upside.
Technical Analysis
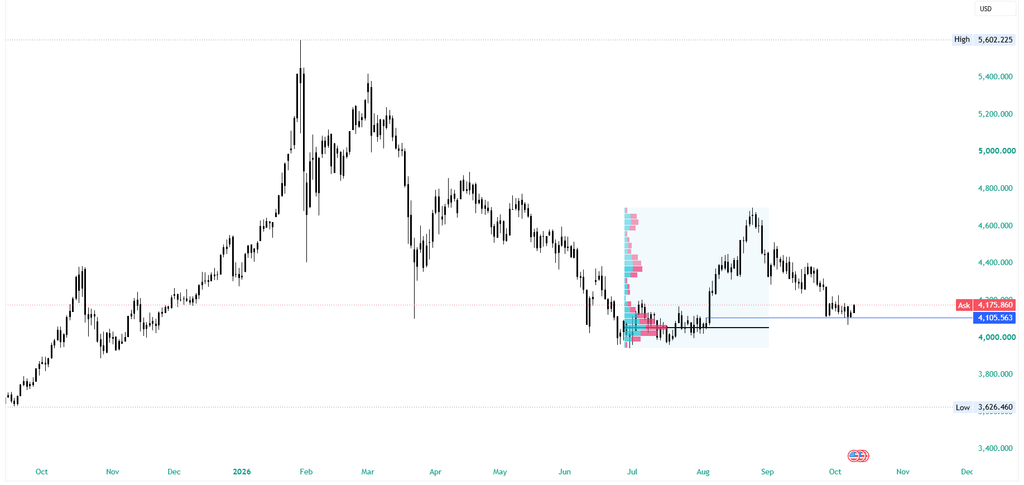
Throughout Q3 2026, Gold experienced an aggressive expansion cycle followed by a full-scale distribution retracement. After spending July compressing tightly near the lower range ($3,960 – $4,105), price initiated a powerful August expansion up toward the $4,694.00 weekly supply zone in early September. Heavy distribution at that peak subsequently triggered a steep rollover, returning price directly back to test the primary accumulation base and the $4,105.563 Weekly Point of Interest (POI) before posting the current bounce to $4,175.860.
Q3 Price Action Recap (July – September 2026)
- July Base Compression ($3,960 – $4,105): Following a steep multi-month markdown from the macro high of $5,602.225, Gold consolidated into heavy volume accumulation throughout July, building energy between the $4,051.00 floor and the $4,105.563 pivot.
- August Expansion Surge: Stored energy from the July base resolved into an aggressive upside breakout, clearing multiple resistance tiers and driving price through a multi-hundred-dollar impulse.
- September Distribution & Rejection ($4,694.00): The rally met institutional supply at the $4,694.00 high-volume cluster in early September. Failure to sustain higher prices triggered an aggressive liquidation through mid-to-late September, bringing the market back down to retest the original Q3 breakout shelf at $4,105.563.
Key Technical Zones
- Current Price (Ask): $4,175.860 — Experiencing a relief bounce off the primary weekly demand floor.
- Immediate Resistance / Overhead Supply: $4,281.93 – $4,300.00 — The Point of Control from late-September consolidation before the final breakdown leg. Serves as the primary ceiling for short-term relief rallies.
- Q3 Local Top / Weekly Supply Zone: $4,694.00 — The cycle distribution high that halted the Q3 rally and triggered the multi-week sell-off.
- Cycle Macro High: $5,602.225 — The overarching macro peak.
- Weekly Point of Interest (POI) / Key Support: $4,105.563 — The critical upper boundary of the July accumulation cluster. Buyers have defended this shelf to establish the current rebound.
- Major Base Floor / Accumulation POC (Black Line): $4,051.00 — The ultimate structural support floor from July’s high-volume block.
- Cycle Macro Low: $3,626.460 — The long-term multi-month floor.
Trading Strategy & Outlook
- Macro Bearish / Relief Rebound Bias: While the broader market remains within a macro downtrend from $5,602, the successful defense of the $4,105.563 Weekly POI keeps a short-term relief bounce active toward overhead supply.
- Relief Rally Scenario (Upside Target): As long as the $4,105.563 POI holds on a daily closing basis, the corrective push can extend higher to retest the $4,281.93 overhead supply cluster.
- Short Continuation Scenario: If price reaches the $4,281 – $4,300 resistance block and displays rejection candles, it offers high-probability setups to rejoin the dominant macro trend. Conversely, a decisive breakdown below $4,105.563 opens the door for a retest of the $4,051.00 accumulation floor.
USD/JPY Outlook
Fundamental Analysis
Heading into Q4, the outlook for USD/JPY will remain heavily influenced by the interest rate differential between the United States and Japan, with Fed policy continuing to be the dominant fundamental driver. Despite the BoJ’s recent shift toward tighter monetary policy, US interest rates remain significantly higher, keeping the US–Japan rate differential wide and providing continued support for the US dollar against the Japanese Yen.
However, several factors could challenge this support. A sustained decline in oil prices could ease inflationary pressures and reduce expectations for further Fed tightening, particularly if lower energy costs are accompanied by weaker US economic activity.
At the same time, Japanese intervention risk remains an important constraint on USD/JPY. Previous intervention by Japanese authorities has demonstrated that moves toward or above 160 can trigger significant market reactions and disrupt the relationship between USD/JPY and US yields. This creates an important ceiling for the pair even if the underlying rate differential remains supportive.
For Q4, key US releases including CPI, PCE, and payrolls will be particularly important in determining the Fed’s policy outlook, while Japanese inflation, wages and BoJ communication will influence expectations for further rate hikes.
Overall, USD/JPY enters Q4 with continued fundamental support from the wide US–Japan rate differential, but intervention risk and the potential for weaker US inflation or growth create meaningful downside risks, suggesting a more balanced outlook for the pair.
Technical Analysis
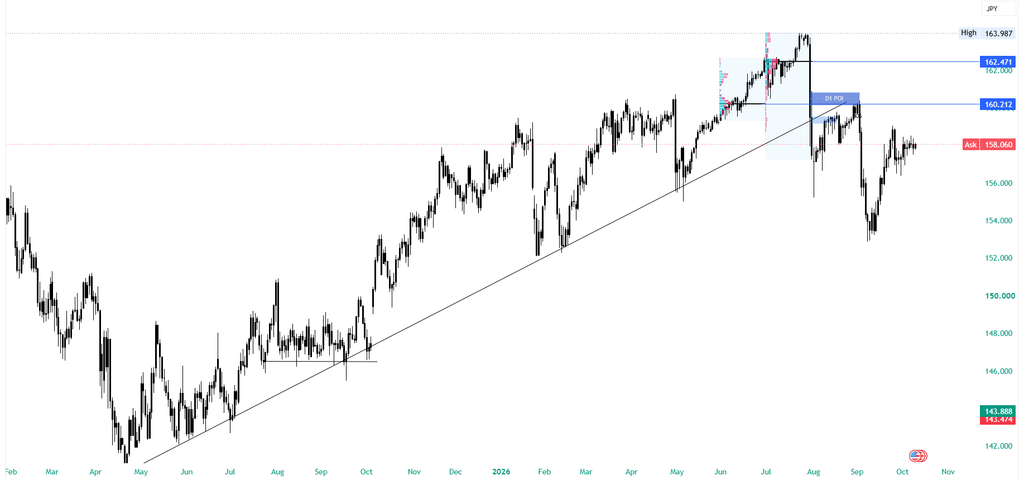
USD/JPY closed out Q3 2026 with a decisive structural shift from a multi-month bull run into an aggressive macro correction. After reaching a cycle peak of 163.991 in July, heavy distribution and a breakdown below key support structures altered the higher-timeframe trajectory, pulling the pair down toward 153.50 before a late-quarter relief rebound to the current 158.060 level.
Q3 Price Action Recap (July – September 2026)
- July Peak & Distribution (163.991): The market posted its cycle top at 163.991 before establishing heavy volume consolidation around the 162.471 Point of Control (POC). Exhaustion at these highs triggered aggressive institutional selling.
- August Structural Breakdown (D1 POI & Trendline): Sellers forced price through the 160.212 support floor (Daily POI) and broke below the multi-month ascending trendline that guided price action since the May lows (~141.50).
- September Flush & Relief Rally: Downside momentum accelerated toward the 153.50 – 154.00 liquidity zone in September. Buyers stepped in to defend this base, initiating the current multi-week corrective bounce back toward 158.060.
Key Technical Zones
- Current Price (Ask): 158.060 — Consolidating in the upper half of the post-drop recovery leg, approaching overhead technical resistance.
- D1 Point of Interest (POI) / Key Resistance: 160.212 — Former primary support turned major overhead resistance. This level aligns with the underside retest of the broken ascending trendline, creating a high-probability supply cluster.
- Q3 High-Volume POC: 162.471 — The Point of Control from July’s distribution top. Acts as the ultimate invalidation pivot for macro bearish structure.
- Cycle High: 163.991 — The macro peak and key liquidity high.
- Immediate Support / Q3 Low: 153.500 – 154.000 — The September swing-low floor that halted the Q3 sell-off.
- Macro Demand Floor: 146.500 – 148.000 — The major horizontal accumulation base from mid-2026.
Trading Strategy & Outlook
- Macro Bearish / Corrective Relief Bias: The broader trend structure remains bearish following the loss of the ascending trendline and the 160.212 structural pivot. However, short-term momentum is currently corrective (relief rally).
- Pullback / Re-test Scenario (Short Opportunities): If the current bounce extends into the 160.00 – 160.212 (D1 POI) confluence zone, watch for price rejection and exhaustion signs to position for continuation shorts aligned with the macro breakdown.
- Continuation Scenario (Downside): Failure to sustain momentum above 158.00, or a confirmed rejection at the D1 POI, targets an initial move back down to 155.00, followed by a re-test of the 153.50 – 154.00 Q3 low.
Crude Oil Outlook
Fundamental Analysis
Heading into Q4, the outlook for crude oil remains heavily influenced by geopolitical developments, physical supply disruptions and the direction of global inventories. The ongoing US–Iran conflict and disruptions around the Strait of Hormuz remain major sources of uncertainty, while attacks on regional energy infrastructure have further reduced the availability of crude supplies. With global inventories falling rapidly, the latest EIA outlook expects Brent crude to average around $105 per barrel in Q4, reflecting continued tightness in the physical oil market.
The diesel market is another important factor supporting crude oil demand. Exceptionally tight diesel supplies are encouraging refiners to maximize diesel production, which increases demand for crude feedstock. At the same time, disruptions to refinery operations and fuel production in regions such as Russia could keep refined-product markets tight, providing additional support for oil prices even if crude supply gradually improves.
However, the outlook is not without downside risks. The IEA expects weaker global oil demand in 2026, raising concerns about demand destruction if elevated energy prices persist. Meanwhile, producers and exporters have been adapting to the disruption by using alternative export routes and other methods to maintain oil flows. A continued recovery in these alternative routes could gradually reduce supply pressures and weaken the geopolitical premium in oil prices.
Inventories will therefore remain a key indicator for Q4. Further declines in global inventories would reinforce the case for elevated oil prices, while a sustained recovery in oil flows and eventual inventory rebuilding could increase downside pressure. The balance between persistent supply disruptions and improving supply flexibility will be particularly important in determining the direction of the market.
Overall, crude oil enters Q4 with strong near-term fundamental support from geopolitical disruptions, falling inventories and tight diesel markets, while weaker demand and the gradual recovery of alternative supply routes create downside risks. The key question for Q4 will be whether physical supply constraints remain severe enough to outweigh improving supply flows and weaker demand.
Technical Analysis
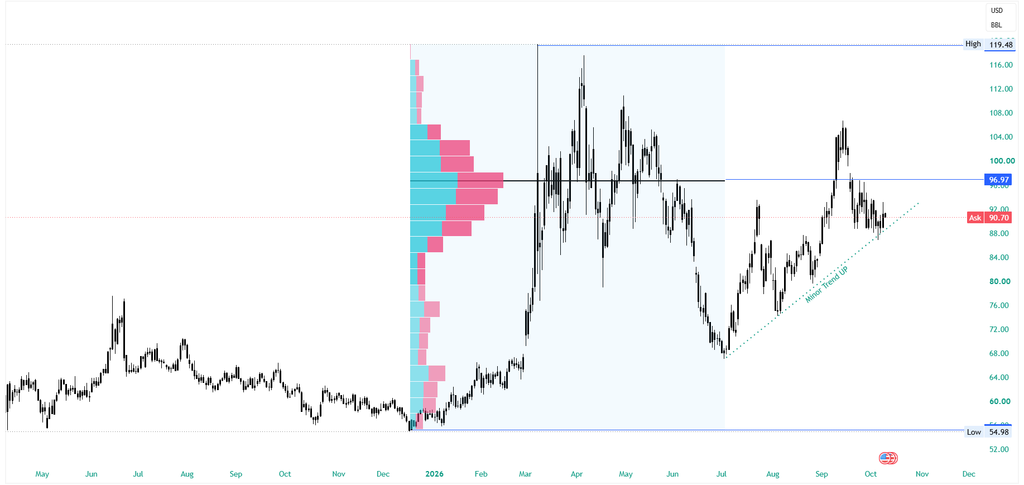
USOIL staged a powerful recovery throughout Q3 2026, transitioning from a sharp mid-year capitulation into an aggressive ascending impulse. After bottoming out at $68.00 in early July, crude embarked on a multi-month rally guided by a rising ascending support line (“Minor Trend UP”), topping out near $106.00 in early September before pulling back to consolidate at the current $90.70 level.
Q3 Price Action Recap (July – September 2026)
- July Reversal & Bottoming ($68.00): After a sustained multi-month decline from the $119.48 cycle peak, price action exhausted at the $68.00 baseline in early July, establishing the primary macro swing low of Q3.
- August Momentum Surge: Aggressive buying volume propelled oil above multiple resistance layers, establishing the Minor Trend UP ascending trendline and reclaiming the psychological $80.00 – $90.00 handle.
- September Peak ($106.00) & Compression Retracement: The rally peaked around the $105.50 – $106.00 liquidity pocket in early September, falling short of the macro $119.48 high. Heavy profit-taking pushed price into a multi-week retracement, bringing it directly back to test the ascending trendline support and the $90.70 asking price.
Key Technical Zones
- Current Price (Ask): $90.70 — Compressing directly along the ascending dynamic trendline support.
- Immediate Resistance / Macro POC: $96.97 — The horizontal Point of Control (POC) from the previous high-volume distribution block. Reclaiming this level is required to reopen macro upside momentum.
- Q3 Local High / Swing Resistance: $106.00 — The September rejection high and immediate swing-trade liquidity target.
- Macro High: $119.48 — The cycle peak and long-term supply barrier.
- Dynamic Support: Minor Trend UP (~$88.00 – $90.00) — The ascending trendline originating from the July low. As long as price respects this diagonal, the intermediate bullish market structure remains intact.
- Q3 Base Support Floor: $68.00 — The structural swing low of July that marked the beginning of the Q3 impulse.
Trading Strategy & Outlook
- Intermediate Bullish / Trendline Defense Bias: While short-term momentum from the September peak is corrective, the overarching structure since July remains constructive as long as the “Minor Trend UP” trendline holds.
- Trendline Bounce Scenario (Long Continuation): If buyers defend the $88.00 – $90.70 trendline cluster and print a bullish reversal structure, look for an initial re-test of the $96.97 POC, with an extended target toward the $106.00 September swing high.
- Breakdown Scenario (Trend Invalidation): A clean daily close below $88.00 will invalidate the ascending trendline, shifting short-term control back to sellers and triggering a deeper liquidation down toward $82.00, and potentially the $72.00 – $68.00 macro demand base.
Conclusion
Q4 2026 begins with markets facing a delicate balance between resilient economic growth, persistent inflation and ongoing geopolitical risks. The US economy remains relatively strong, but signs of slower labor-market momentum could become increasingly important if they continue into the final quarter. At the same time, inflation remains above the Fed’s target, leaving monetary policy relatively restrictive and keeping Treasury Yields and the US dollar sensitive to incoming economic data.
Across major asset classes, the outlook will therefore depend heavily on how these competing forces develop. Gold could benefit from moderating inflation, lower Treasury Yields and reduced expectations for further Fed tightening, while persistent energy-driven inflation could continue to limit its upside. USD/JPY remains supported by the wide US–Japan interest-rate differential, but intervention risks and the possibility of weaker US economic data create meaningful downside risks. Crude oil, meanwhile, enters Q4 with stronger near-term support from geopolitical disruptions, falling inventories and tight diesel markets, although improving supply routes and weaker demand could eventually ease these pressures.
Overall, the key theme for Q4 will be whether inflationary and geopolitical pressures begin to ease without a significant deterioration in global economic growth. A more favorable combination of lower energy prices, moderating inflation and less restrictive monetary policy could create a more supportive environment across financial markets. Conversely, persistent inflation, elevated energy prices and continued supply disruptions could keep central banks cautious, Treasury Yields elevated and market volatility high.
As a result, Q4 is likely to remain highly sensitive to economic data, central-bank communication and geopolitical developments, making the interaction between these factors particularly important for the direction of major currencies, commodities and other asset classes.
